In this reference, we will describe details about the traffic visualisation solution based on Grafana technology.
For FastNetMon's proprietary traffic visualisation solution FastNetMon LiveView, refer here.
Supported report types
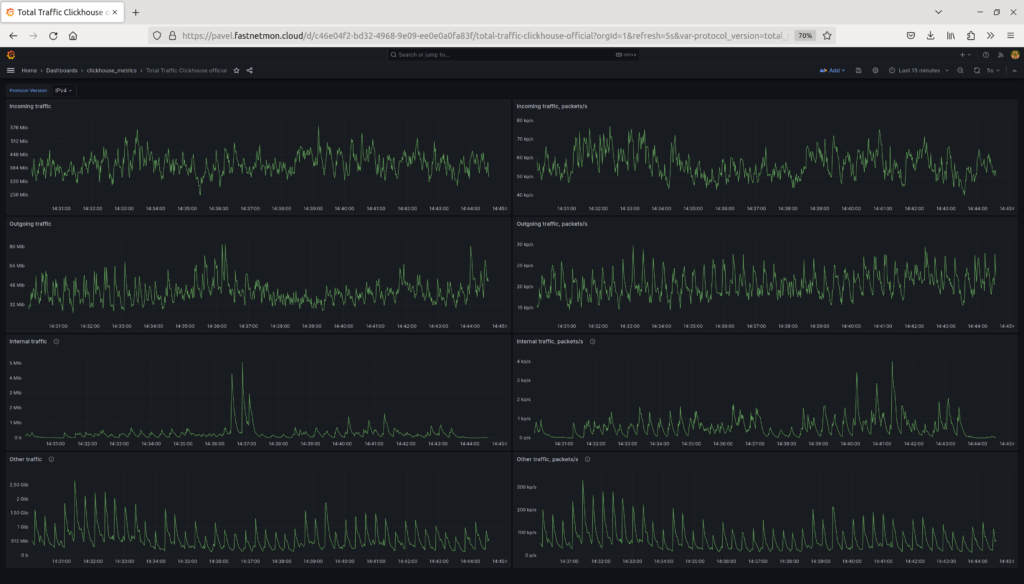
- Total traffic
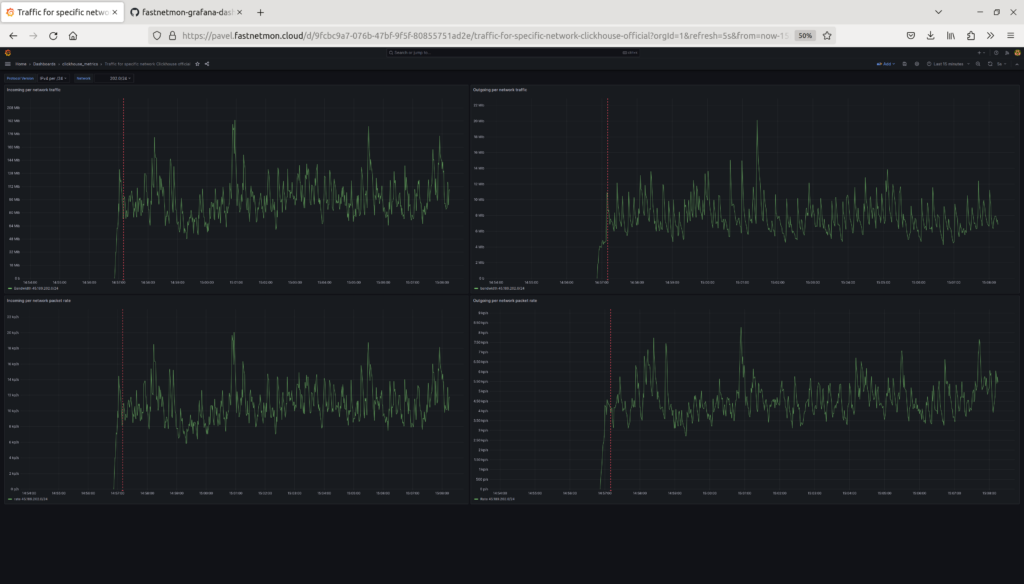
- Traffic for a specific prefix
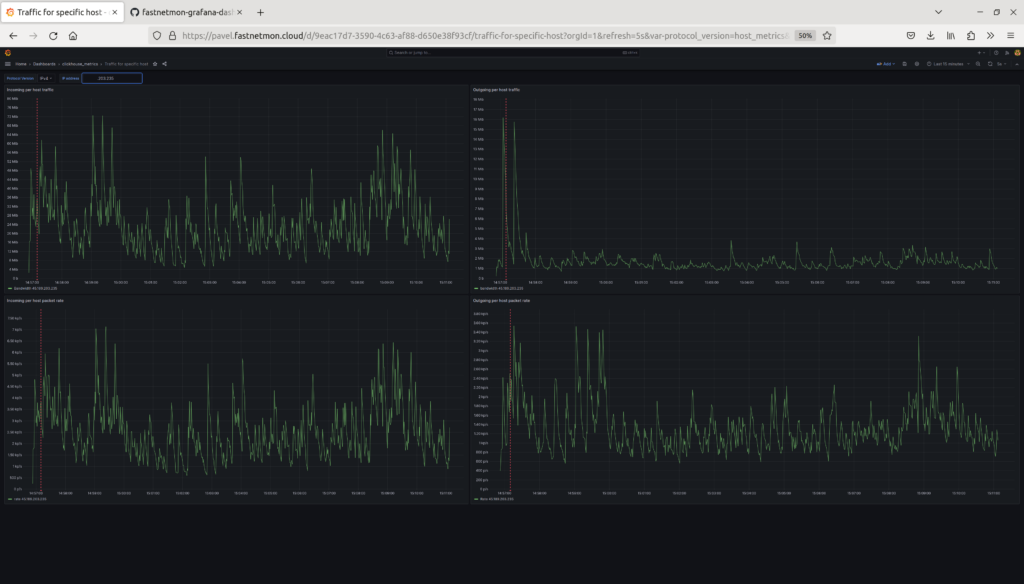
- Traffic for a specific host
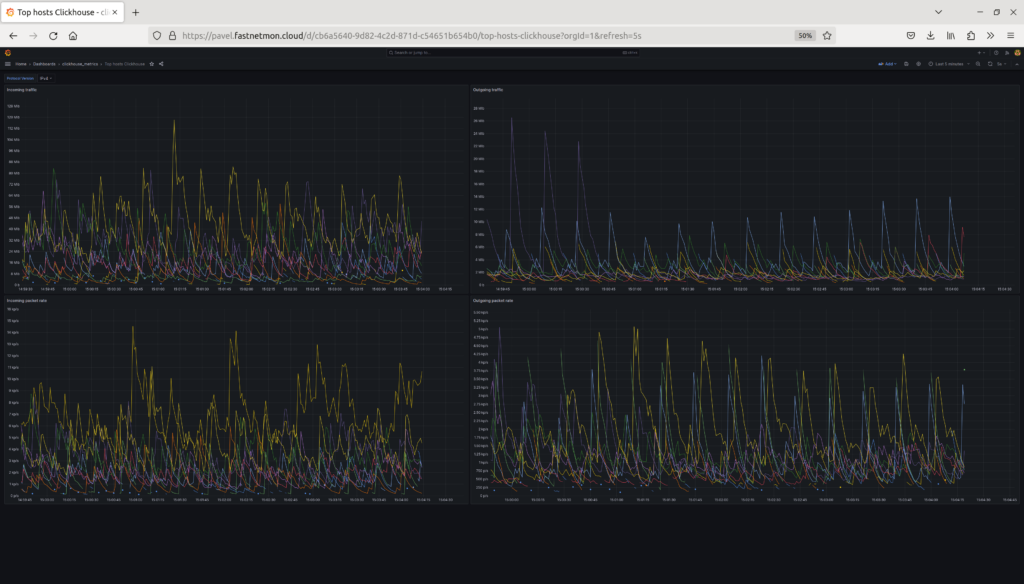
- Top hosts by traffic
- Top networks by traffic
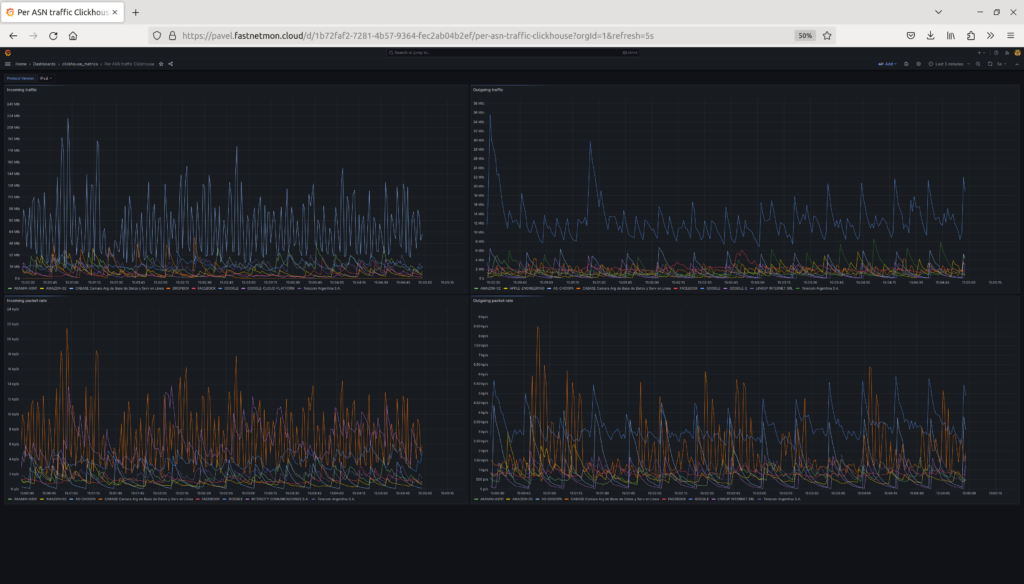
- Top ASNs by traffic
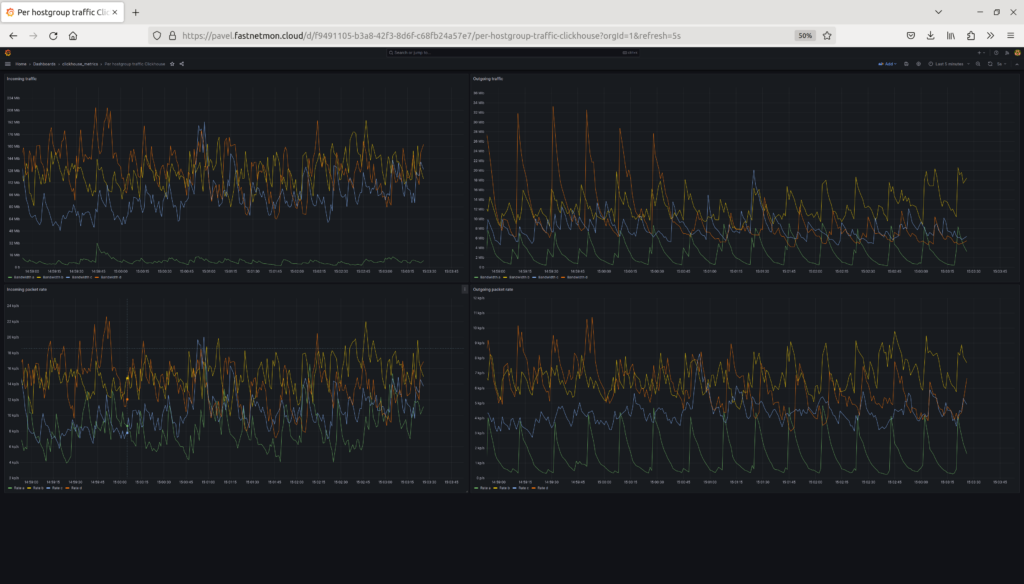
- Total traffic per hostgroup
- Detailed traffic flows database
All graphs are provided for IPv4 and IPv6.
We maintain all our official dashboards as a repository at GitHub.
System requirements
Please note that your CPU should support SSE 4.2 instruction set for our time series database Clickhouse. On some virtualisation platforms like Proxmox, this capability is disabled even if CPU supports. You will need to follow this guide to enable it
Install steps
For installing the graphic stack, we usea special flag from FastNetMon’s installer.
wget https://install.fastnetmon.com/installer -Oinstaller
sudo chmod +x installer
sudo ./installer -install_graphic_stack
Please carefully read the output of the installer tool and remember the passwords for Grafana. During installation, Grafana and Clickhouse will be installed, configured and integrated with FastNetMon.
To access Grafana, you use HTTP connection to port 81 or HTTPS connection to port 443 (Debian / Ubuntu only).
Please note that dashboard "traffic database" uses traffic persistence capability which needed to be enabled separately
By default, FastNetMon usesa self-signed SSL certificate available in your system. You may switch to your own SSL certificates by changing the following fields in file /etc/nginx/sites-enabled/grafana.conf:
ssl_certificate /etc/ssl/certs/ssl-cert-snakeoil.pem;
ssl_certificate_key /etc/ssl/private/ssl-cert-snakeoil.key;
After that, you will need to restart Nginx to apply the changes:
sudo systemctl restart nginx
You can reset the password for any user or add a new user with a unique password using the following procedure:
wget https://install.fastnetmon.com/installer -Oinstaller
sudo chmod +x installer
sudo ./installer -reset_visual_passwords -visual_login admin
If you would like to create a non-admin user after running this command, you need to use your "admin" account, open https://10.0.0.1/admin/users and create a user with the same login and password:
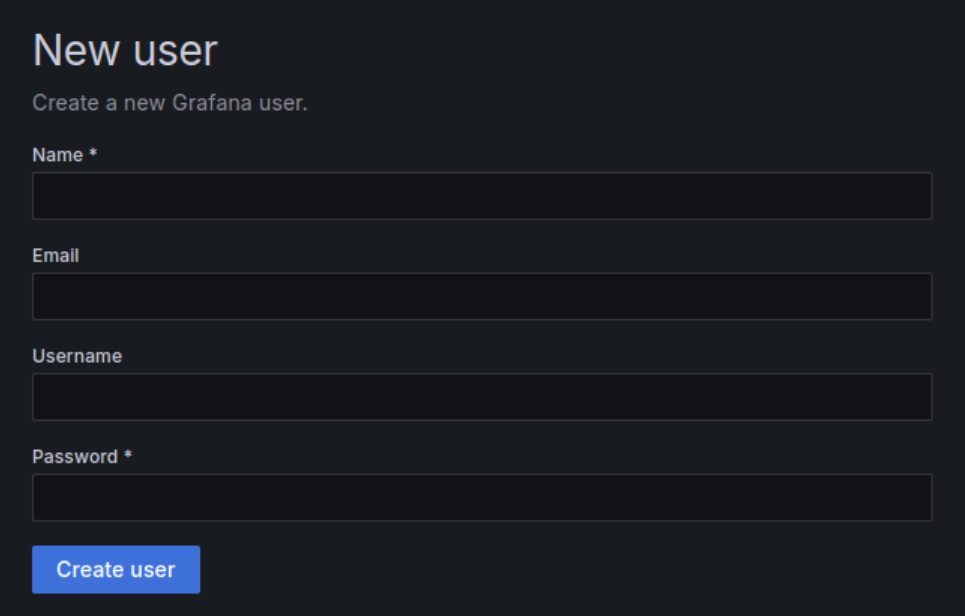
It's required because we use HTTP basic authentication for increased security, which is not synchronised with Grafana user database.
We use automatic provision of dashboards from folder, and FastNetMon installer creates the following file /etc/grafana/provisioning/datasources/fastnetmon.yaml to enable this capability:
apiVersion: 1

providers:
  - name: dashboards
    type: file
    updateIntervalSeconds: 30
    editable: true
    options:
      path: /var/lib/grafana/fastnetmon_dashboards
      foldersFromFilesStructure: true
Then we copy dashboards from GitHub as is to the following folder /var/lib/grafana/fastnetmon_dashboards. If you want to do it manually, you can do it this way:
sudo git clone https://github.com/FastNetMon/fastnetmon-grafana-dashboards.git /var/lib/grafana/fastnetmon_dashboards
If you would like to update dashboards on existing installation you can do it this way:
wget https://install.fastnetmon.com/installer -Oinstaller
sudo chmod +x installer
sudo ./installer -install_grafana_dashboards
Due to Grafana limitation, we have to hardcode UID for Clickhouse datastore this way in data source provisioning file /etc/grafana/provisioning/datasources/fastnetmon-clickhouse.yaml:
datasources:
- orgId: 1
  version: 1
  name: Clickhouse official
  type: grafana-clickhouse-datasource
  uid: fastnetmonclickhouseofficialdatasourceuid
  jsonData:
    defaultDatabase: fastnetmon
    port: 9000
    server: "127.0.0.1"
    username: "grafana"
    tlsSkipVerify: false
  secureJsonData:
    password: "very-secure-password-replace-it"
For InfluxDB (deprecated since July 2024), we have it slightly different way in /etc/grafana/provisioning/datasources/fastnetmon.yaml:
apiVersion: 1
datasources:
- orgId: 1
  version: 1
  name: InfluxDB
  type: influxdb
  access: proxy
  url: https://127.0.0.1:8086
  database: fastnetmon
  isDefault: true
  uid: fastnetmoninfluxdbdatasource
After making any changes with provision you will need to restart Grafana:
sudo systemctl restart grafana-server
You may check the detailed guide for manual configuration of Clickhouse for metrics (recommended) and InfluxDB (obsoleted, deprecated, not recommended).
After this setting, you could see data on your graphs. Below you can find a few example dashboards.
If you run a very old version of Grafana, or you have previously experienced issues with Grafana's authentication and access to Clickhouse. In this case, we recommend completely removing Grafana. You can use the following commands to remove all Grafana configuration:
sudo systemctl stop grafana-server.service
sudo apt-get remove --purge grafana
sudo rm -rf /var/lib/grafana/
sudo rm -rf /etc/grafana/
And then run the visual installer again:
wget https://install.fastnetmon.com/installer -Oinstaller
sudo chmod +x installer
sudo ./installer -install_graphic_stack