Introduction
FastNetMon has bundled ability to store all traffic inside a special column-oriented database. You could store all traffic inside it and retrieve it using a well-known SQL syntax.
System requirements
You should have a working instance of FastNetMon before using this guide. Also, you need to install visual traffic stack because we use Grafana for traffic persistence.
Configure FastNetMon to store traffic in the traffic database
sudo fcli set main traffic_db_host 127.0.0.1
sudo fcli set main traffic_db_port 8100
sudo fcli set main traffic_db enable
sudo fcli commit
If you run port mirror mode, you may need to adjust this value, which has the purpose of reducing load on the database and sampling all incoming data in addition to the sampling rate configured on port mirror plugin side. If you run port mirror with a reasonable sampling rate, then you can set this value to 1.
sudo fcli set main traffic_db_sampling_rate 1
sudo fcli commit
And start traffic_db daemon:
sudo systemctl restart traffic_db
Traffic database daemon uses its own configuration file /etc/fastnetmon/traffic_db.conf, and you can change default options as follows:
{
"traffic_db_host":"127.0.0.1",
"traffic_db_port": 8100,
"clickhouse_batch_size": 1000,
"clickhouse_batch_delay": 1,
"clickhouse_queue_max_batches": 64,
"clickhouse_host": "127.0.0.1",
"clickhouse_port": 9000,
"clickhouse_user": "default",
"clickhouse_password": "",
"clickhouse_database_name": "fastnetmon",
"clickhouse_table_name": "traffic",
"logging_level": "info",
"prometheus_enabled": false,
"prometheus_host": "127.0.0.1",
"prometheus_port": 9091
}
Please note that options clickhouse_database_name and clickhouse_table_name were added in 2.0.363.
The traffic_db daemon writes traffic records to ClickHouse in batches. The clickhouse_batch_size option controls how many records should be accumulated before sending them to ClickHouse. The clickhouse_batch_delay option controls the maximum time, in seconds, to wait before flushing the current batch, even if it has not reached clickhouse_batch_size yet.
A batch is inserted when either the configured batch size is reached, or the configured delay expires.
After making any changes, you need to restart the daemon.
sudo systemctl restart traffic_db
Starting from 2.0.381 we added logic to insert traffic batches using queue (only one insert operation in time), maximum number of entities in queue controlled using clickhouse_queue_max_batches (default value 64). In case of Clickhouse performance issues when number of entries exceeds 64 we drop entire batch and write following message to log file /var/log/fastnetmon/traffic_db.log:
ClickHouse queue is full, dropping oldest batch. Total batches dropped: 1 total packets dropped: 1000
Version 2.0.380 is known to have issue which caused concurrent inserts in Clickhouse which were reflected with following messages in /var/log/fastnetmon/traffic_db.log:
[ERROR] Failed to push data to clickhouse: cannot execute query while inserting, use SendInsertData instead
In this case we strongly recommend upgrading to 2.0.381 which includes queue based Clickhouse insert logic.
Making example queries
Start client:
clickhouse-client --host 127.0.0.1
Example query:
select * from fastnetmon.traffic limit 10;
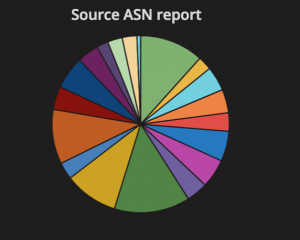
Execute ASN query:
use fastnetmon
SELECT dstAsn, count(dstAsn) AS cnt FROM traffic GROUP BY dstAsn  ORDER BY cnt DESC  LIMIT 10
As output, you could find the number of packets per destination ASN for required time slice.
Clickhouse has logic (TTL) in place to remove data which is older than 7 days.
You can find the SQL schema for traffic table in our GitHub repo.
PacketDirection uses the following integers to encode directions:
- Incoming 0
- Outgoing 1
- Internal 2
- Other 3
Source uses the following integers to encode the plugin which captured traffic:
- Unknown 0
- Mirror 1
- sFlow = 2
- Netflow / IPFIX = 3
- FastNetMon Flow = 4
Default schema uses index configuration, which may not provide the best performance for all types of queries. You can alter the index configuration and then re-create the table using preferred index granularity and configuration for your case. You just need to keep all fields as-is.
After making changes in schema you will need to restart the traffic_db daemon this way:
sudo systemctl restart traffic_db
As another option to speed up certain queries, you can copy all data from the original traffic table to another table with a different index configuration using the MATERIALIZED VIEW capability:
CREATE MATERIALIZED VIEW fastnetmon.traffic_sampled ENGINE = MergeTree PARTITION BY packetDate ORDER BY (srcIp, dstIp, packetDate) TTL packetDate + toIntervalDay(7) SETTINGS index_granularity = 8192
populate as select * from fastnetmon.traffic WHERE rand() % 100 = 1;
In this example, we used sampling with rand() section to make queries even faster, but you can copy all the data without using sampling.
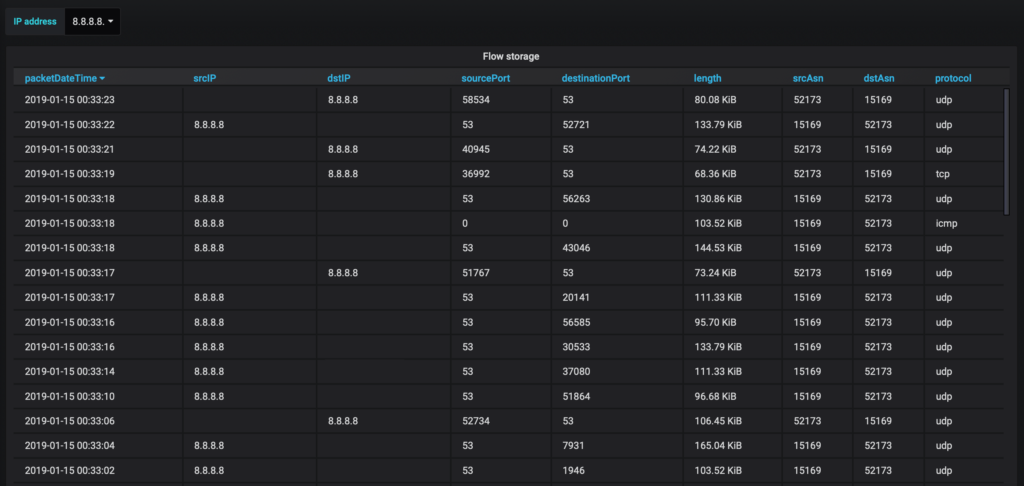
Example dashboards
Dashboards to access traffic flow information are installed by default when you install visual traffic stack.
If you're interested in peering per ASN traffic reports, we recommend using this dashboard.
In case of any issues with traffic_db we recommend checking the following log file: /var/log/fastnetmon/traffic_db.log